The Measurement Trap: Why AI Benchmarks Mislead Your Board
A few weeks ago a single graph set the internet on fire.
A respected AI evaluator published its latest "time horizon" chart. The number on it had climbed again. Within hours the usual voices declared that the machines had arrived, that the curve had broken, that the end of knowledge work was now a matter of months.
Take a breath.
The graph is real. The panic is not. And the gap between the two is exactly where boards lose money on AI. If you advise leaders, sit on a steering group, or own a budget, this is worth ten minutes of your attention.
What The AI Time Horizon Graph Actually Measures
The chart tracks one thing. It asks how long a task would take a human software engineer, then checks whether a frontier model can finish that task. A minute. Then two. Then four. The latest models are now credited with tasks that would take a person most of a working day.
Plotted over time, the line shoots up. It looks like an unstoppable rise toward general intelligence.
It is not. It is a measure of how good these models have become at one narrow thing: writing and fixing code. That is a genuine advance. It is also a long way from "the machines can do your job."
Read the small print and the story changes.
The Fifty Percent Problem
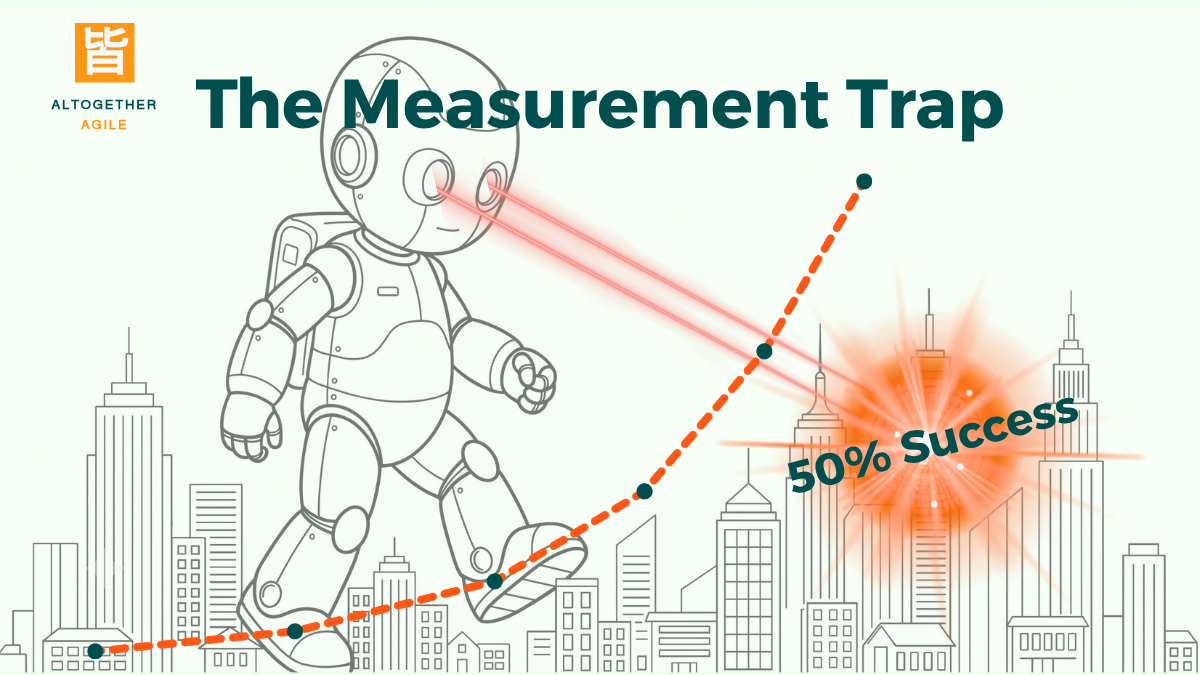
The headline number rests on a fifty percent success rate.
Read that again. The model finishes the task half the time. Flip a coin.
There is a stricter version of the same chart set at eighty percent. It exists. It is far less dramatic, and almost nobody shares it. There is no published version at the ninety five or ninety nine percent that real work demands.
This matters because the whole problem with generative AI has always been reliability. A tool that is right half the time is not a colleague. It is a draft generator that needs a human to check every line.
Your business does not run on fifty percent. Your finance team does not file accounts that are right half the time. Your developers do not ship code that works on every other run. The benchmark measures the easy half of the problem and stays silent on the half that costs you.
A Task Is Not A Job
There is a second sleight of hand.
The chart measures tasks that take a day or two. Real work is rarely a clean task with a clear finish line. It is the job of human to shepherd a solution over months. To weigh trade-offs. To say no to the wrong feature. To know which corner is safe to cut and which will sink the release.
Slicing that into tidy two-day chunks flatters the machine. It measures the part that looks like a benchmark and ignores the part that looks like a job.
So when someone tells you AI can now do "sixteen hours of work," ask the obvious question. Sixteen hours of which work? At what success rate? Checked by whom?
The Trillion Pound Baby Fallacy
Here is the deeper error, and it is the one your board is most likely to make.
The line on the graph has doubled a few times. People look at it and assume it will double forever. Gary Marcus has a sharp name for this. He calls it the "trillion pound baby" fallacy.
A baby doubles its birth weight in a few months. Nobody expects it to keep doubling until it is the size of a building. Early growth tells you almost nothing about where a curve flattens.
Very few exponential trends run forever. They hit walls. Energy. Chips. The limits of teaching a model to pass a specific test. Some problems may simply not bend to the current approach at all.
The same fallacy shows up in the money. When a forecast says a single AI firm will earn trillions within a few years, it is the trillion pound baby again, dressed in a suit. Recent gains have leaned heavily on bolting traditional, rule-based tools onto the models, rather than on the models alone getting bigger. That is a clue the easy doubling may be ending, not accelerating.
Why Benchmarks Cannot Settle A Complex Question
This is where the agile and complexity lens earns its keep.
A benchmark is a test with a known answer. It belongs in the ordered world, where cause and effect are clear and repeatable. Coding and maths sit close to that world, which is exactly why the models do well there. Formal checking can confirm the answer.
Most business value does not live in the ordered world. It lives in the complex one, where the right answer only becomes clear after you act. You cannot benchmark your way to certainty in a complex domain. You probe, you sense, you respond. You keep a human in the loop because judgment is the part the machine cannot fake.
So a rising benchmark tells you the tool is sharper. It does not tell you the tool is safe to trust with your customers, your compliance, or your reputation. Those questions are answered by trying, in the small, and watching what happens.
What This Means For Your AI Adoption
None of this is a reason to ignore AI. The capability is real and it is useful. It is a reason to stop buying the hype curve and start running an empirical process.
Three practical moves.
First, separate Discovery from Delivery. Use AI freely in Discovery, where a fifty percent answer that sparks a better idea is a win. Hold it to a far higher bar in Delivery, where the output ships to a customer.
Second, measure outcomes, not benchmarks. The only score that matters is whether a small, real piece of work got better, faster, or cheaper without breaking. Run the experiment. Read your own data. Trust that over any chart on the internet.
Third, keep the human in the loop as a Definition of Done, not a courtesy. At fifty percent reliability, review is not optional. Build it into the work, and be honest about the time it takes back.
This is not new thinking. It is Business Agility applied to a new tool. Small bets. Tight feedback. Empirical evidence over confident forecasts. The firms that win with AI will not be the ones that believed the graph. They will be the ones that tested it.
How To Read An AI Benchmark Without Getting Fooled
Keep these four questions to hand. Use them the next time a vendor or a headline waves a chart at you.
What success rate is this? If it is not at least ninety percent, it is a demo, not a deliverable.
Is this a task or a job? A clean task flatters the model. A real job exposes it.
What is driving the gains? Bigger models, or bolted-on tools? The answer hints at how long the trend will last.
Does this transfer to my domain? Coding sits in the ordered world. Your hardest problems may not.
The Honest Summary
The machines are getting better at coding. That is true, and it is worth knowing.
They are not getting reliable. They are not doing whole jobs. And the curve will not double forever.
Read the benchmarks. Just read the small print first, and trust your own evidence more than someone else's graph.
By Alun Davies-Baker, Altogether Agile.
Alun Davies-Baker is the founder of Altogether Agile, a London-based agile training and consultancy practice. He writes on Business Agility, complexity, and the practical adoption of AI.
A note on sources: this post draws on points raised in Gary Marcus's analysis of the METR time horizon graph, reworked through a Business Agility and complexity lens. The argument and the practical model are my own.